The Reveal: Analyzing and Presenting Chapter 4 Results with Confidence (Dissertation Workbook – Digital Download)
$46.00
You’ve collected the data.
You’ve examined the patterns.
Now you have to show readers what your study revealed.
And suddenly, having results and writing about them feel like two very different things.
Which findings go where?
How much of that table needs to be explained?
How do you present participant voices without turning your chapter into a collection of quotes?
And how do you keep yourself from writing Chapter 5 before you’ve finished Chapter 4?
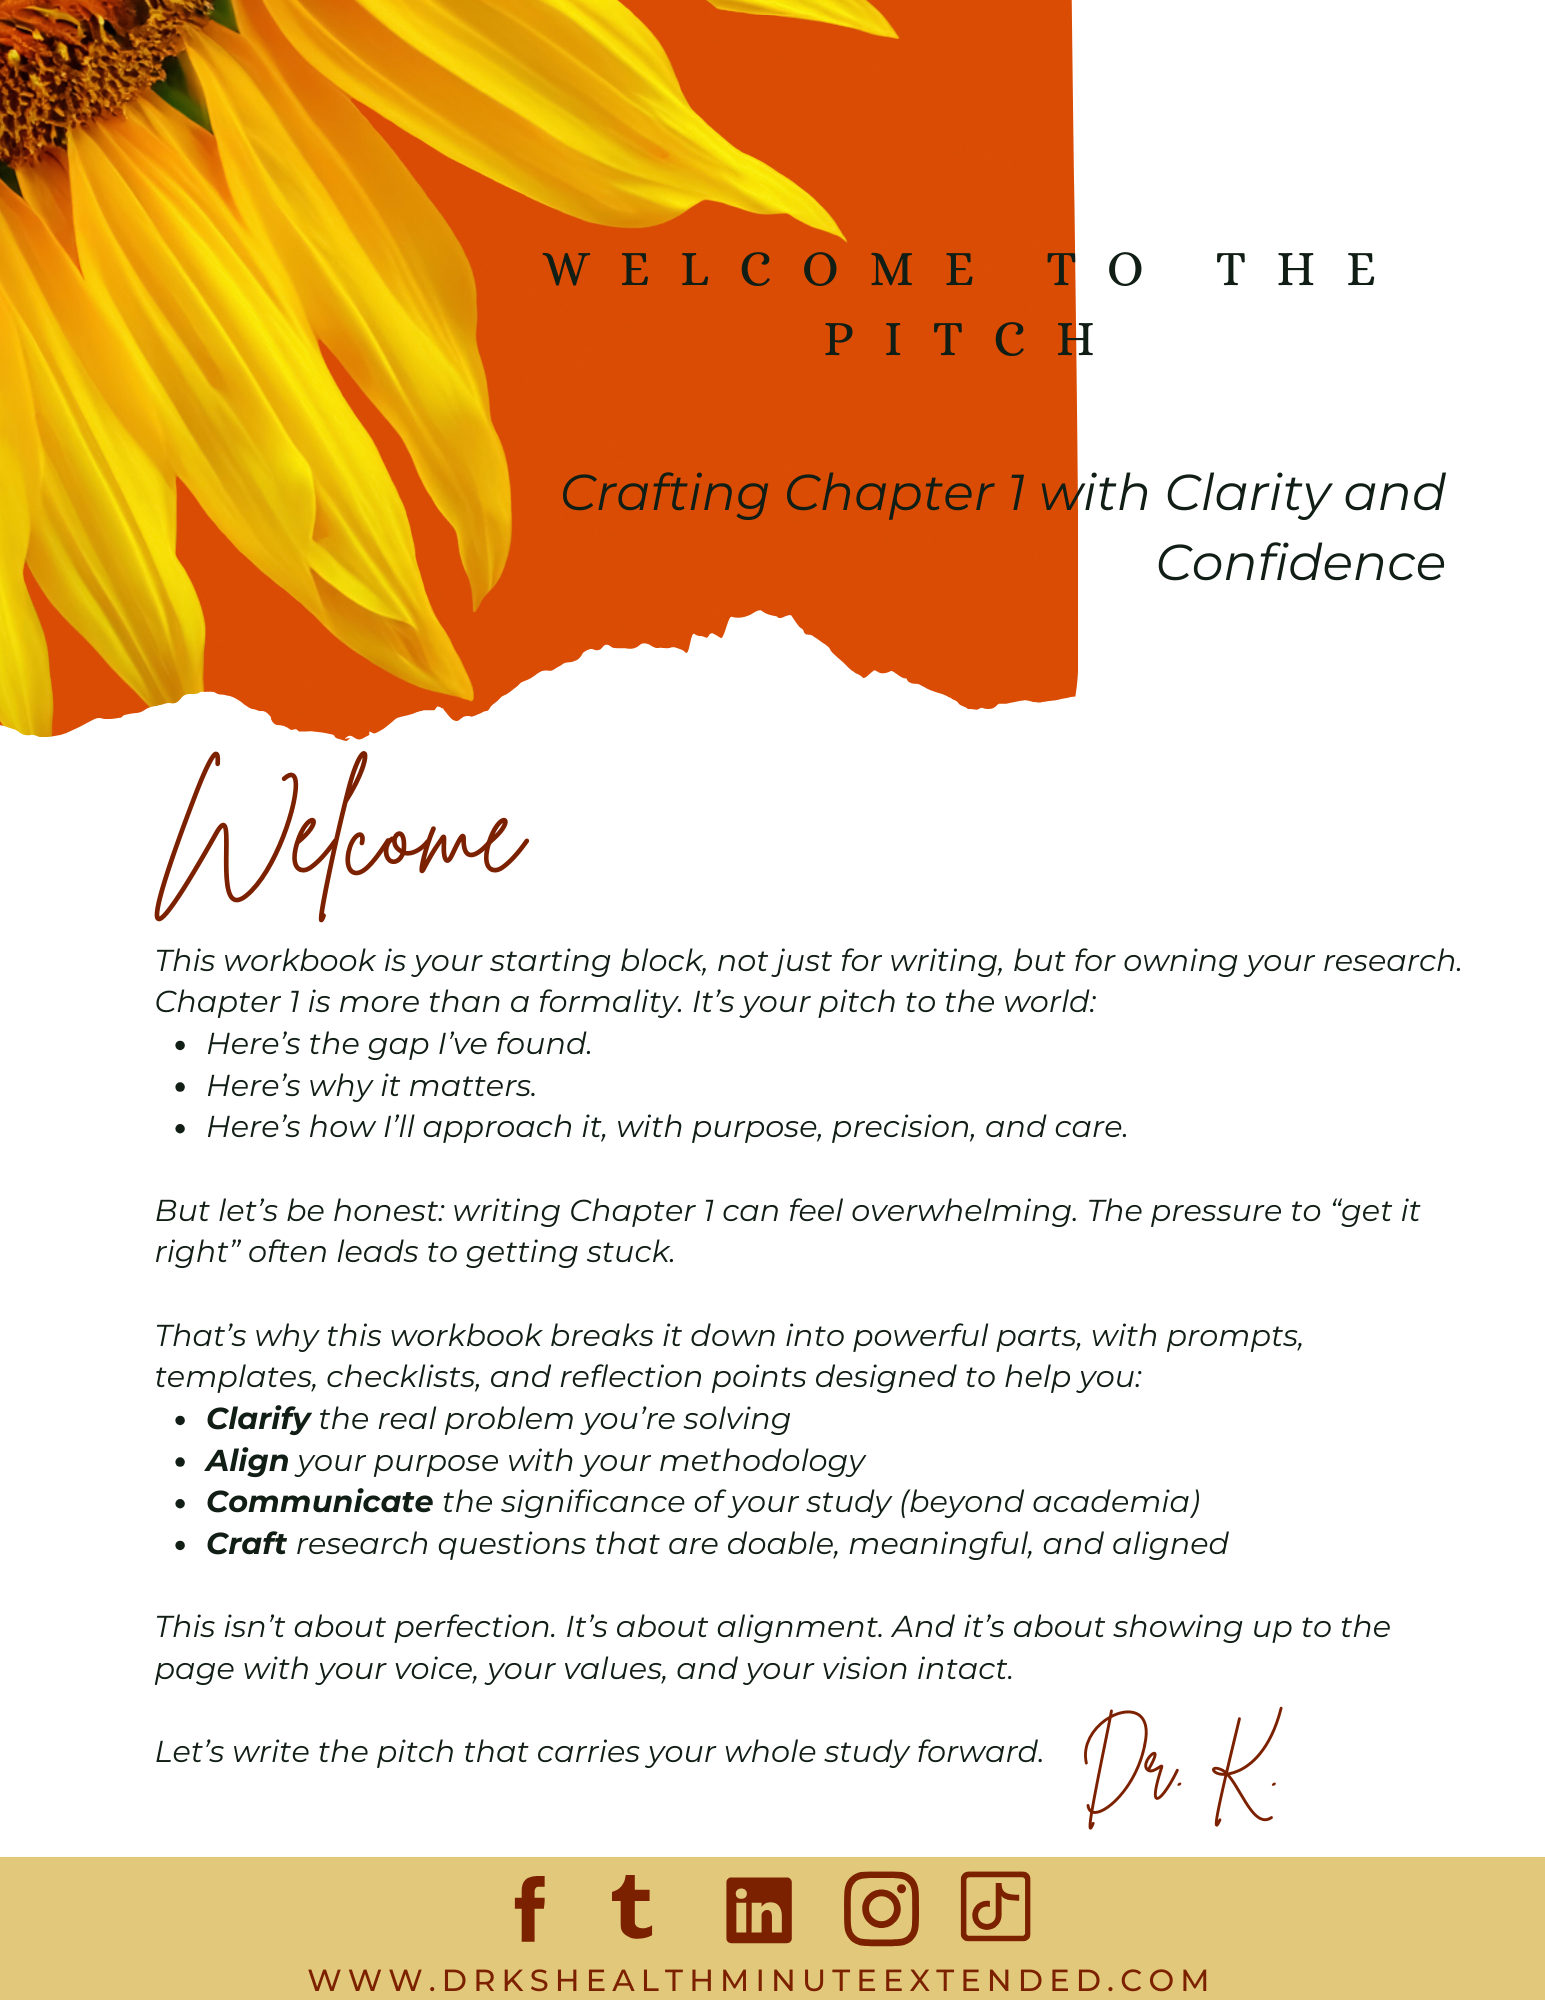
The Reveal: Analyzing and Presenting Results with Confidence is a digital workbook designed to move you from “I have the findings” to “I know how to present them.” Through guided activities, method-specific planning tools, and paragraph builders, you’ll organize your results, develop readable displays, and write a chapter that clearly answers your research questions.
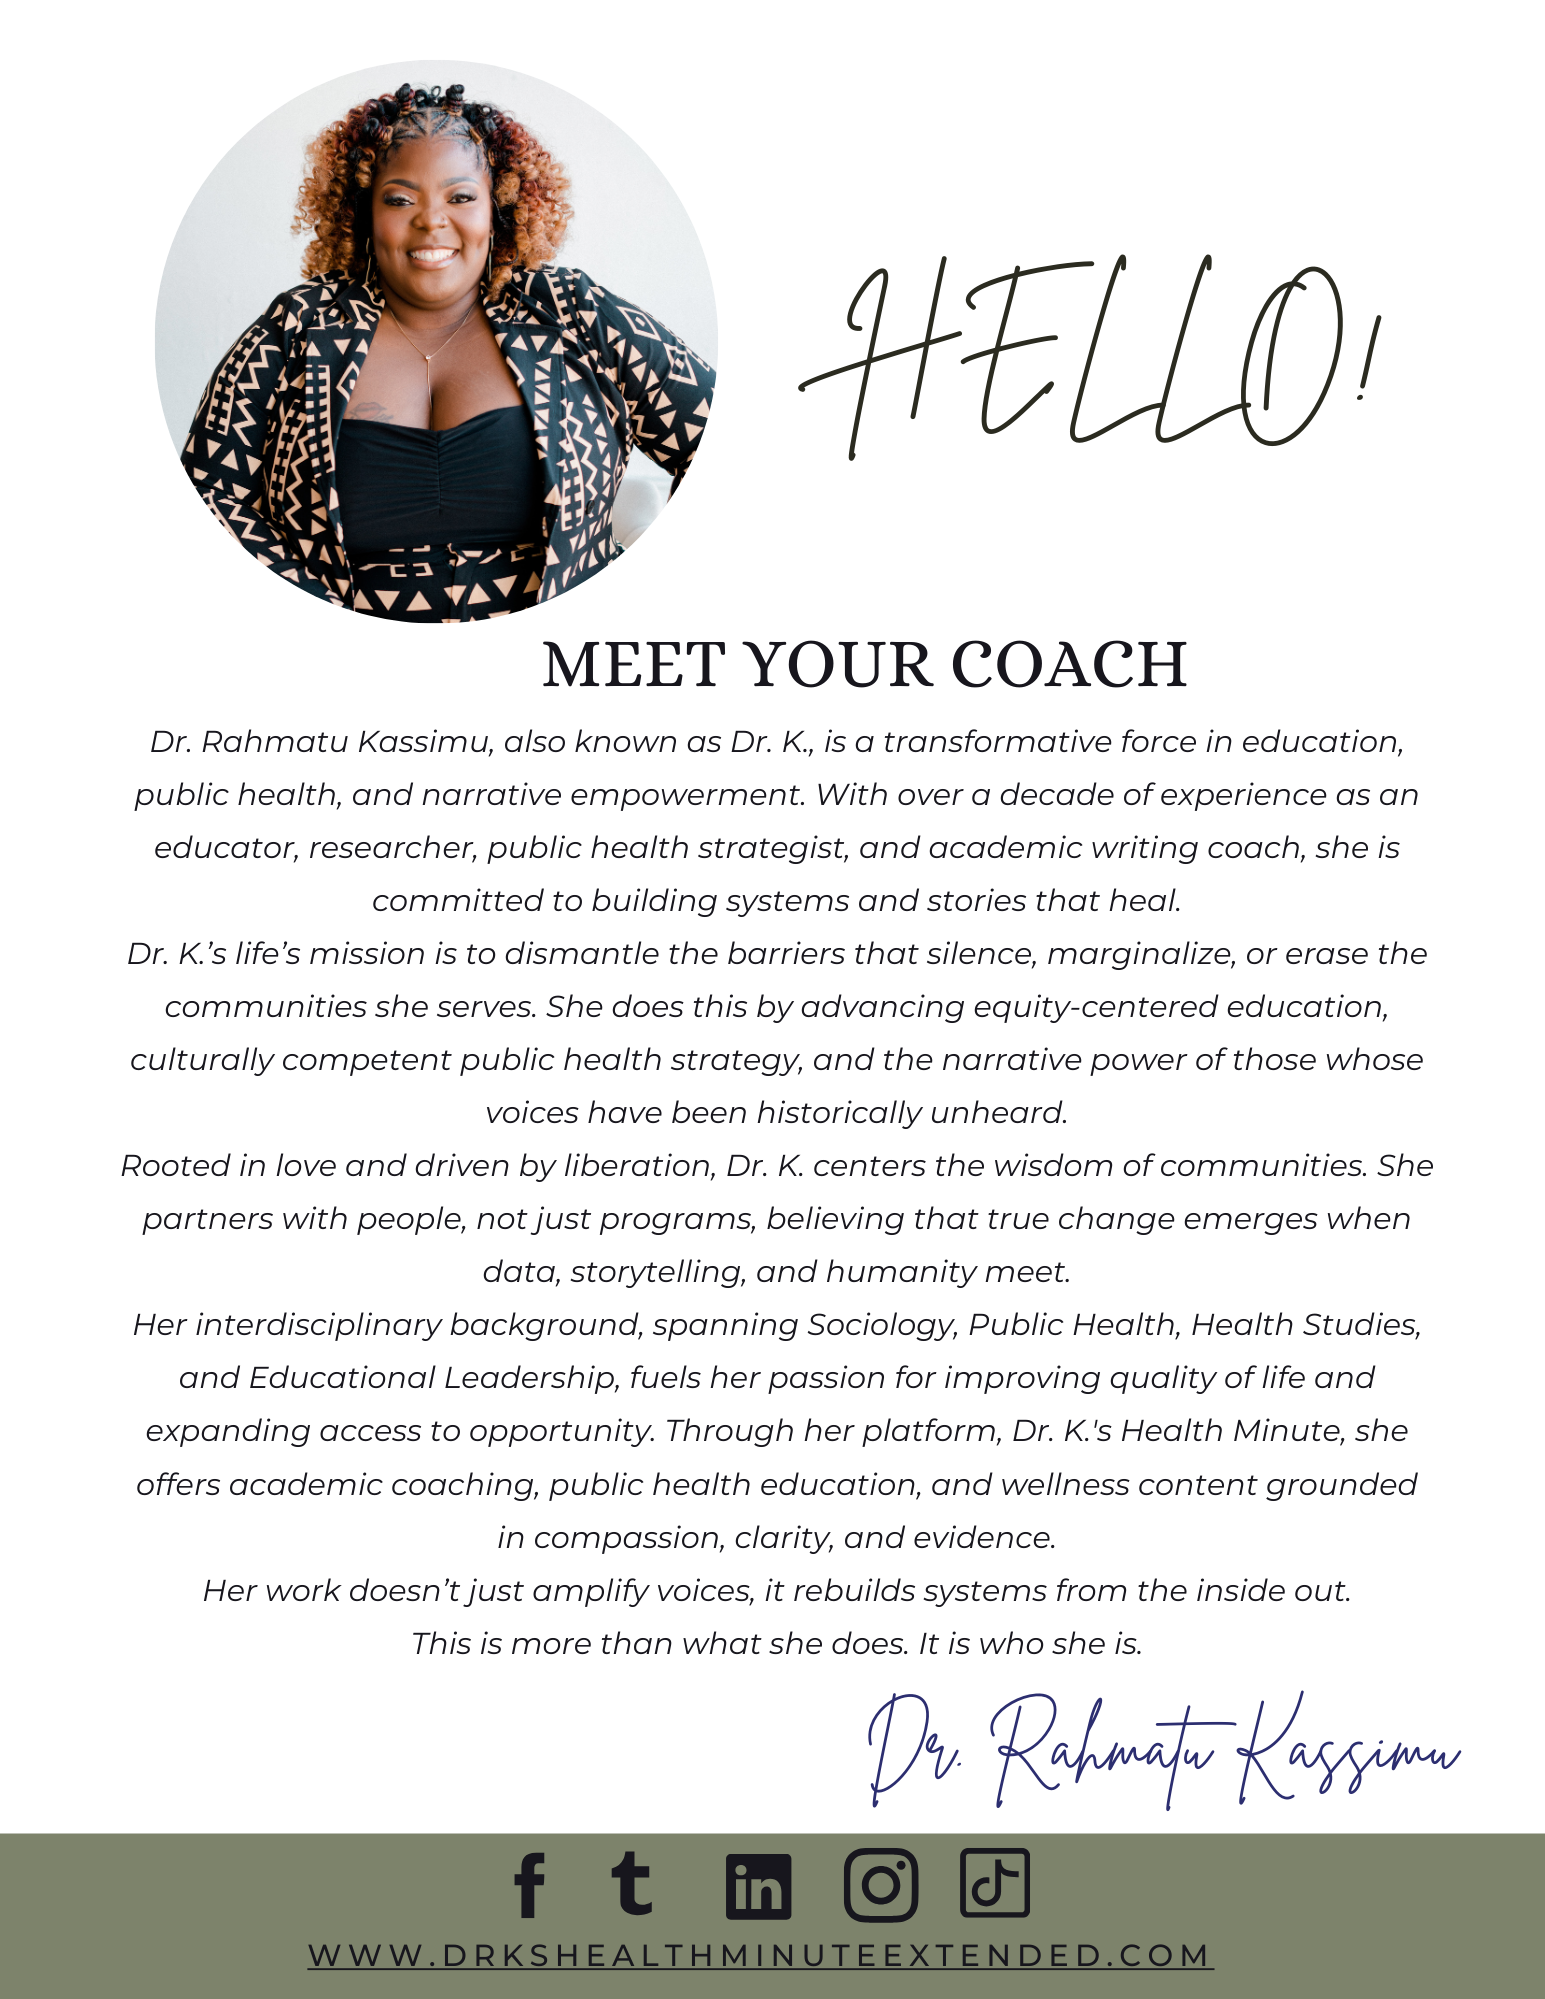
Created by Dr. Rahmatu “Dr. K.” Kassimu, this workbook walks you through the decisions that make Chapter 4 organized, aligned, and grounded in your evidence.
The Reveal is built around three core moves:
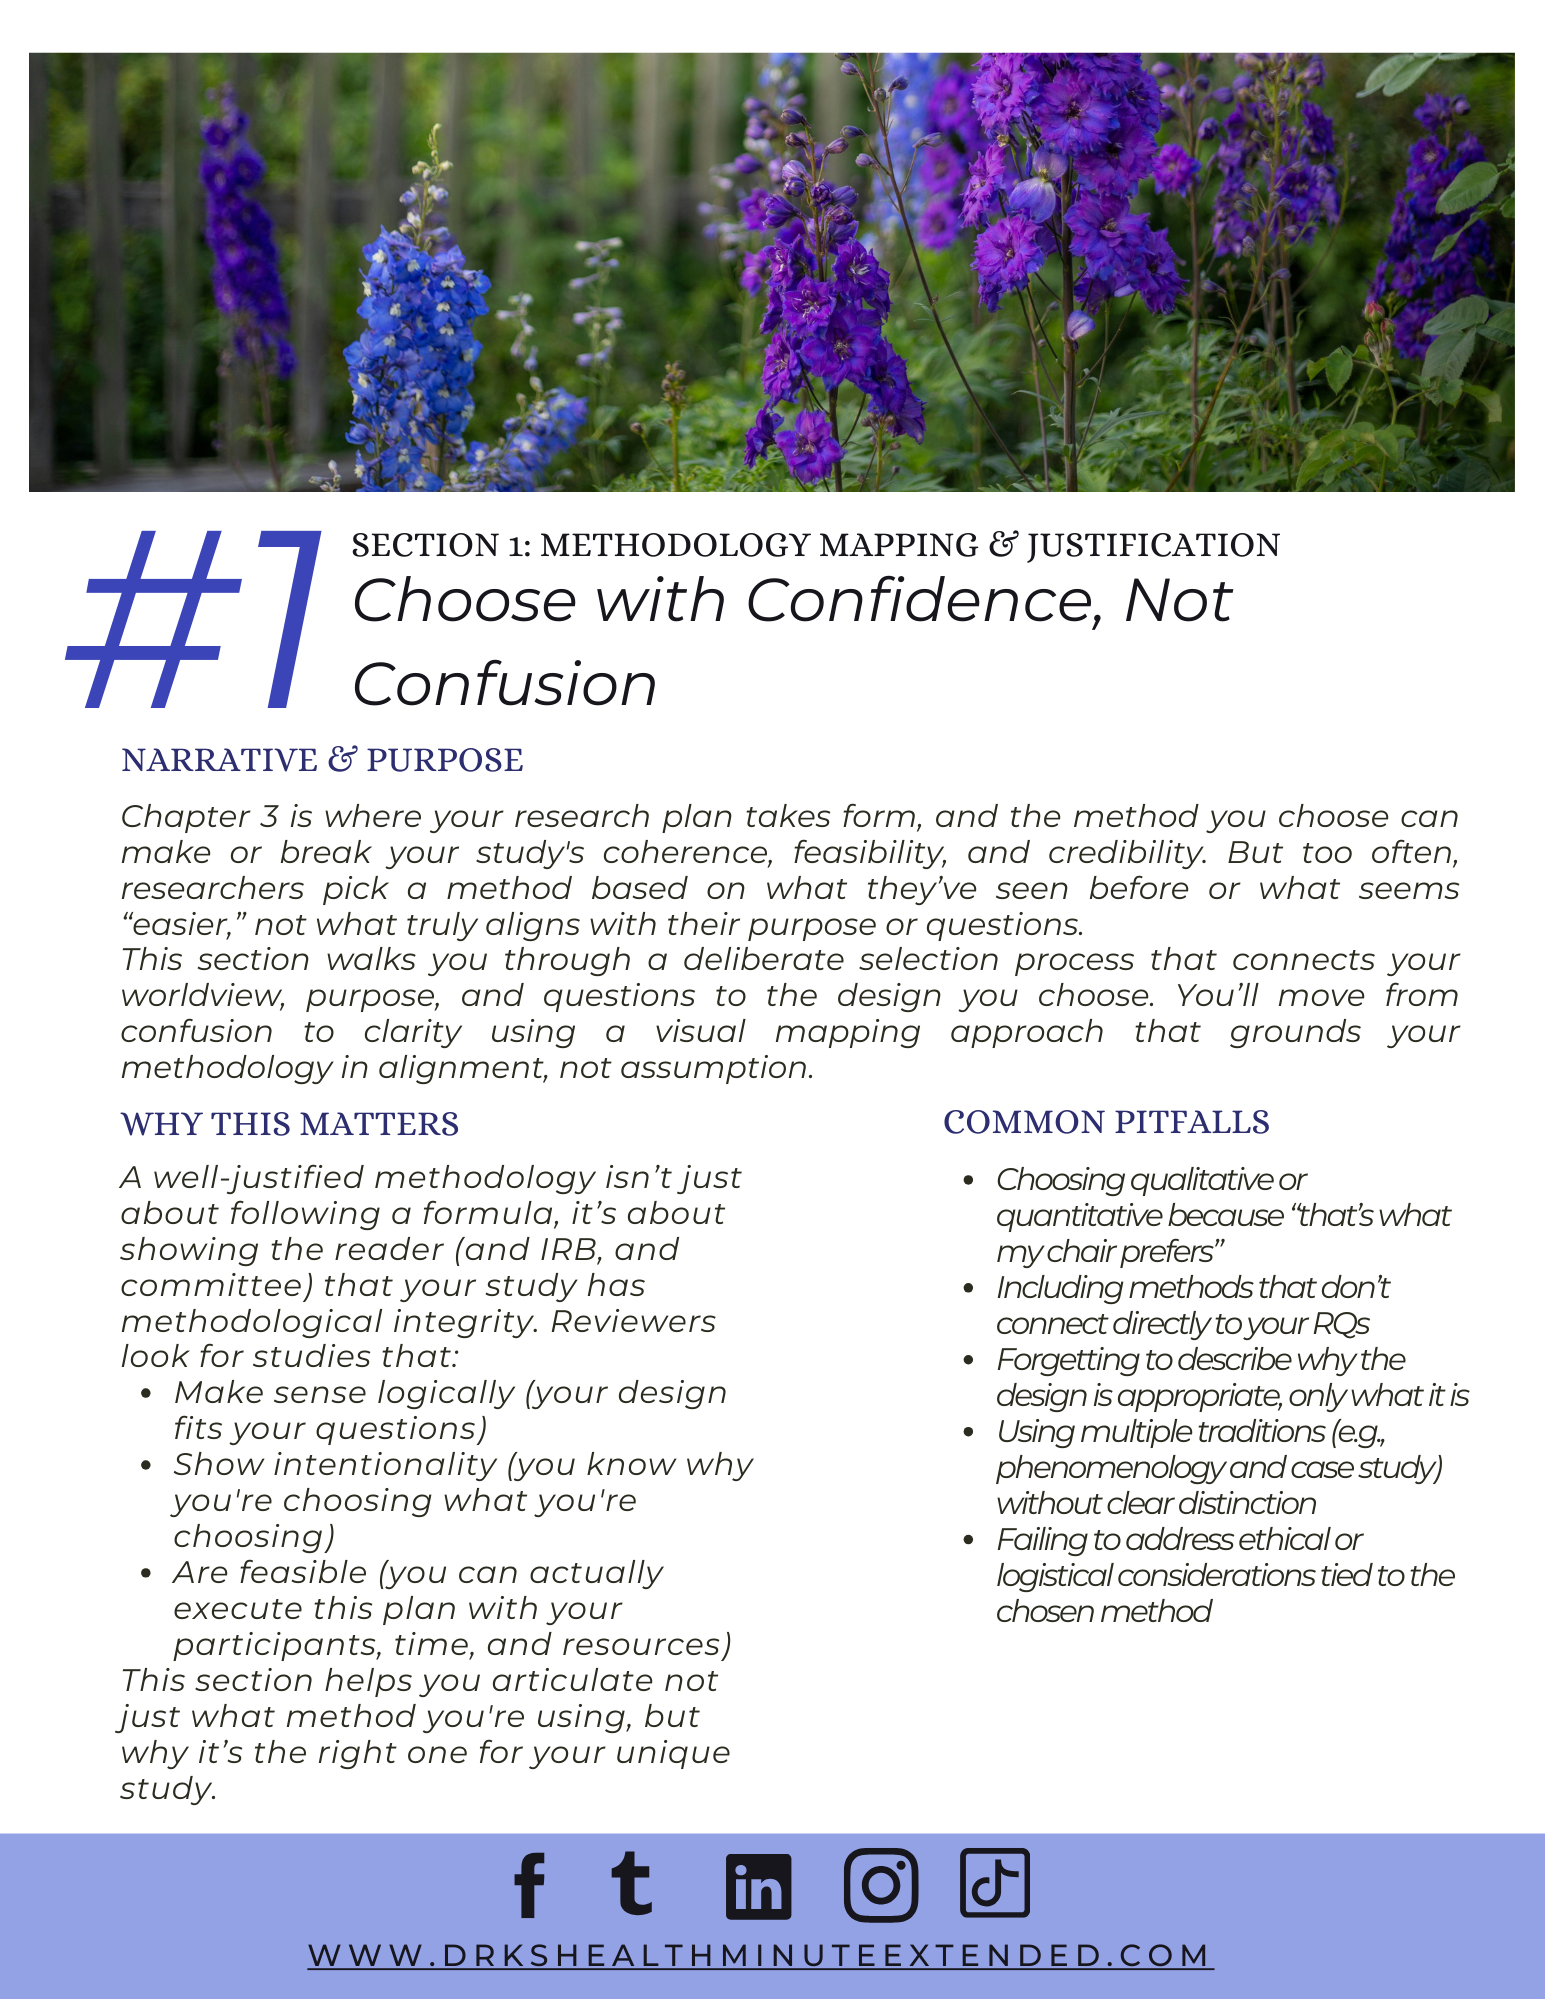
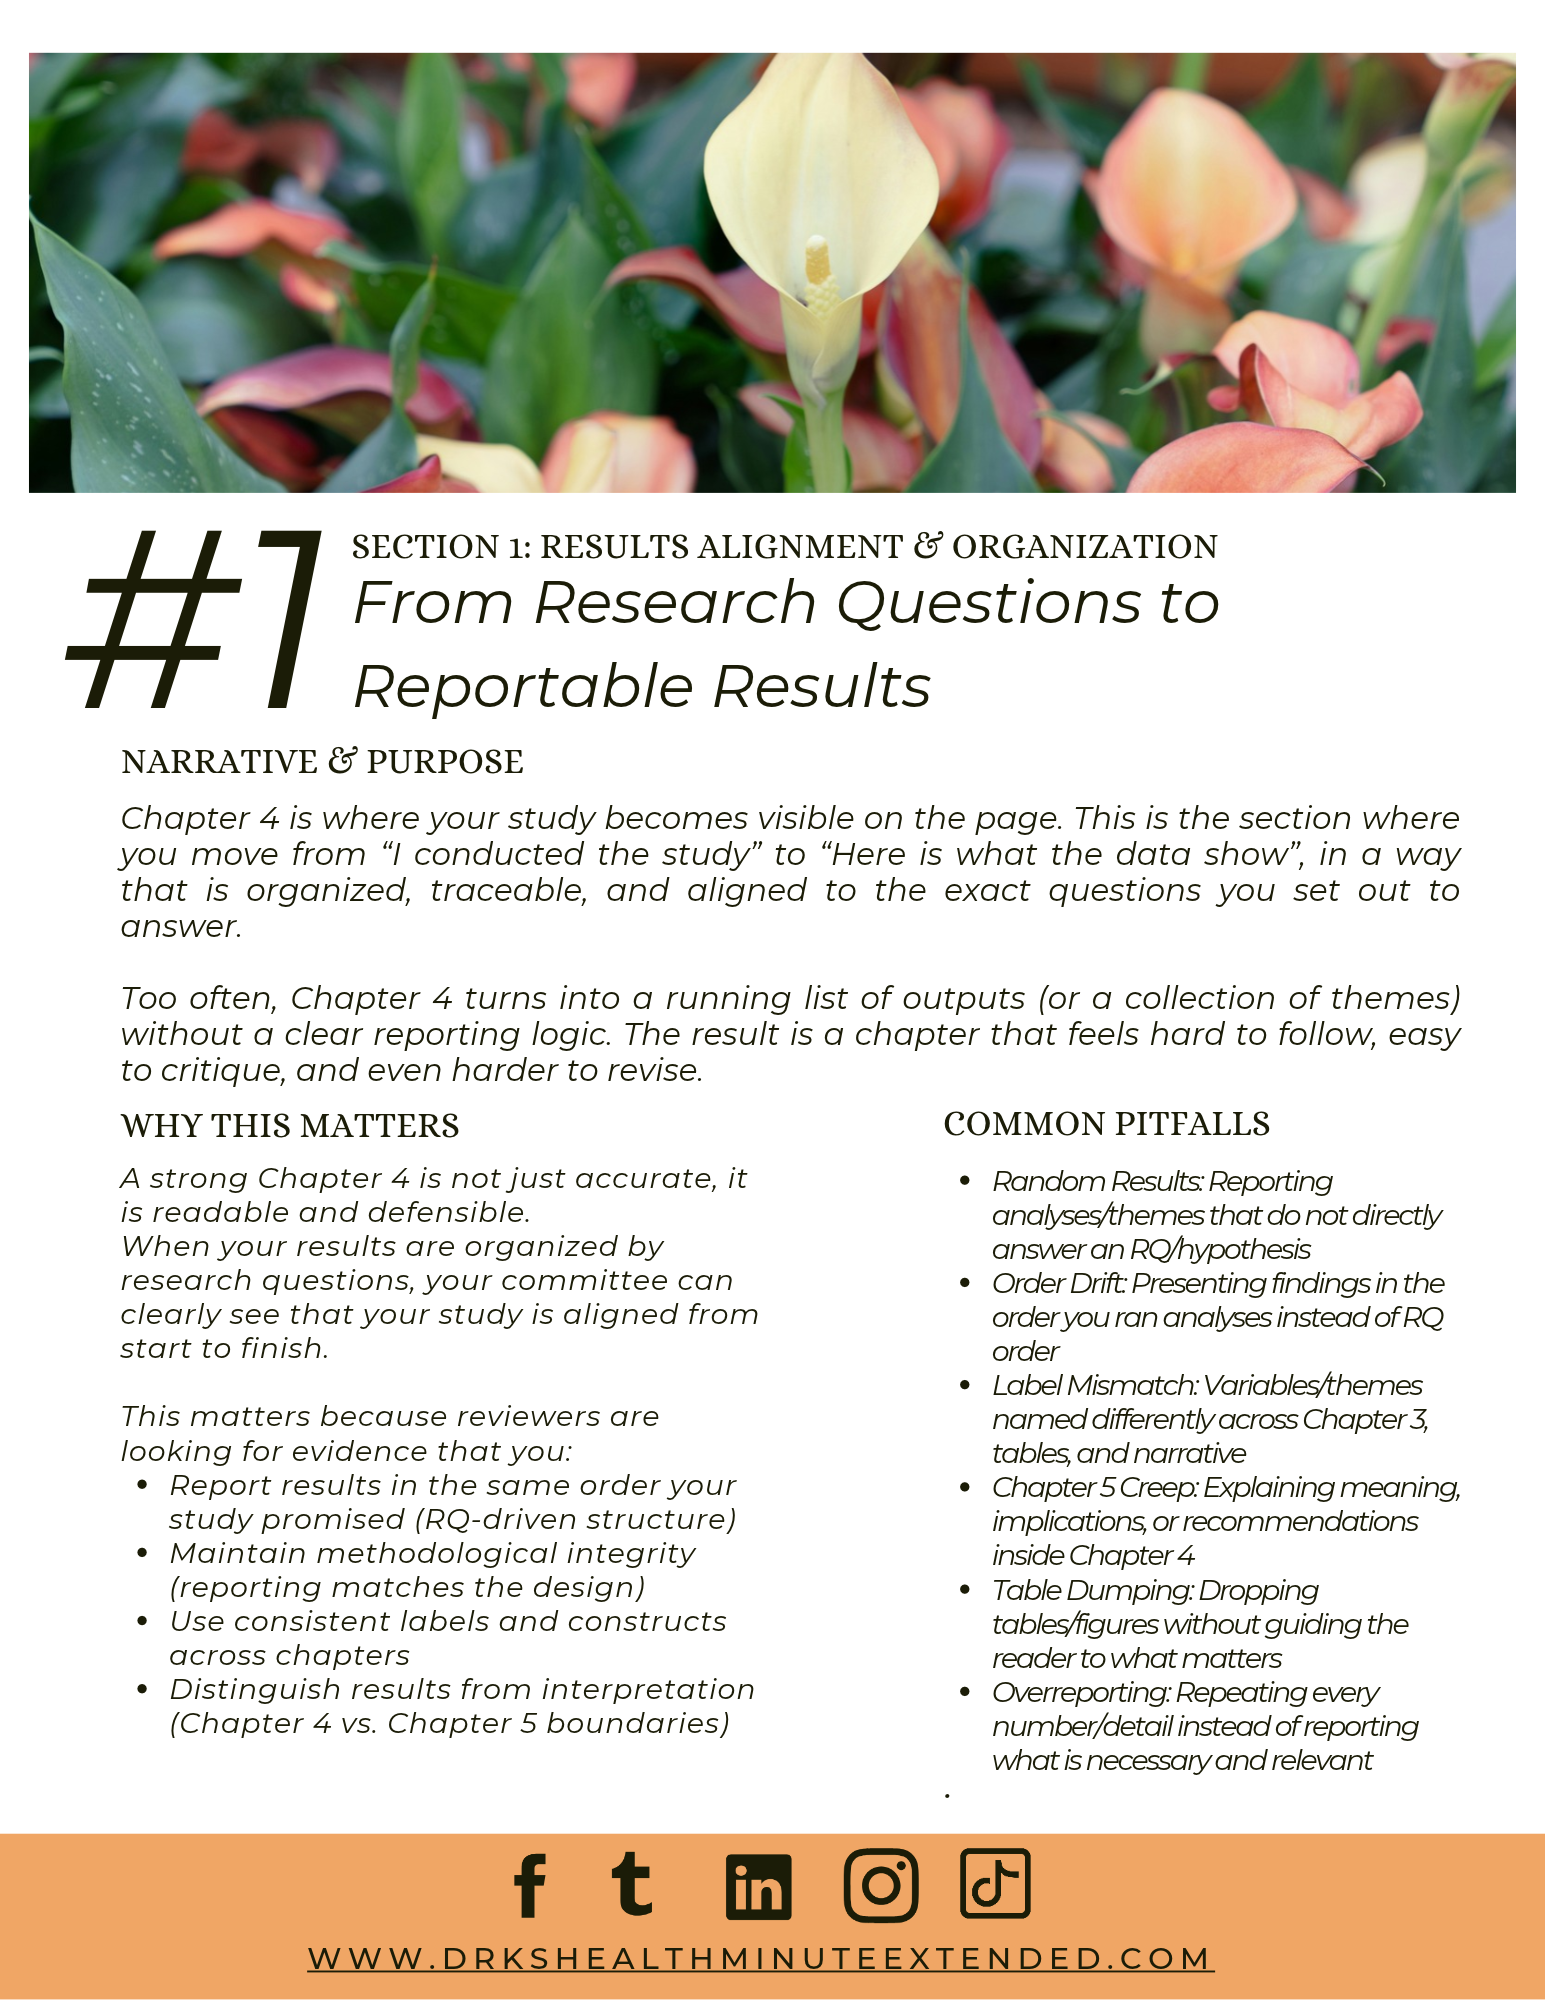
Your Chapter 4 needs a clear reporting structure. Readers should be able to follow the connection between what you asked, how you investigated it, and what you found.
This section helps you organize your findings with intention.
You’ll work through:
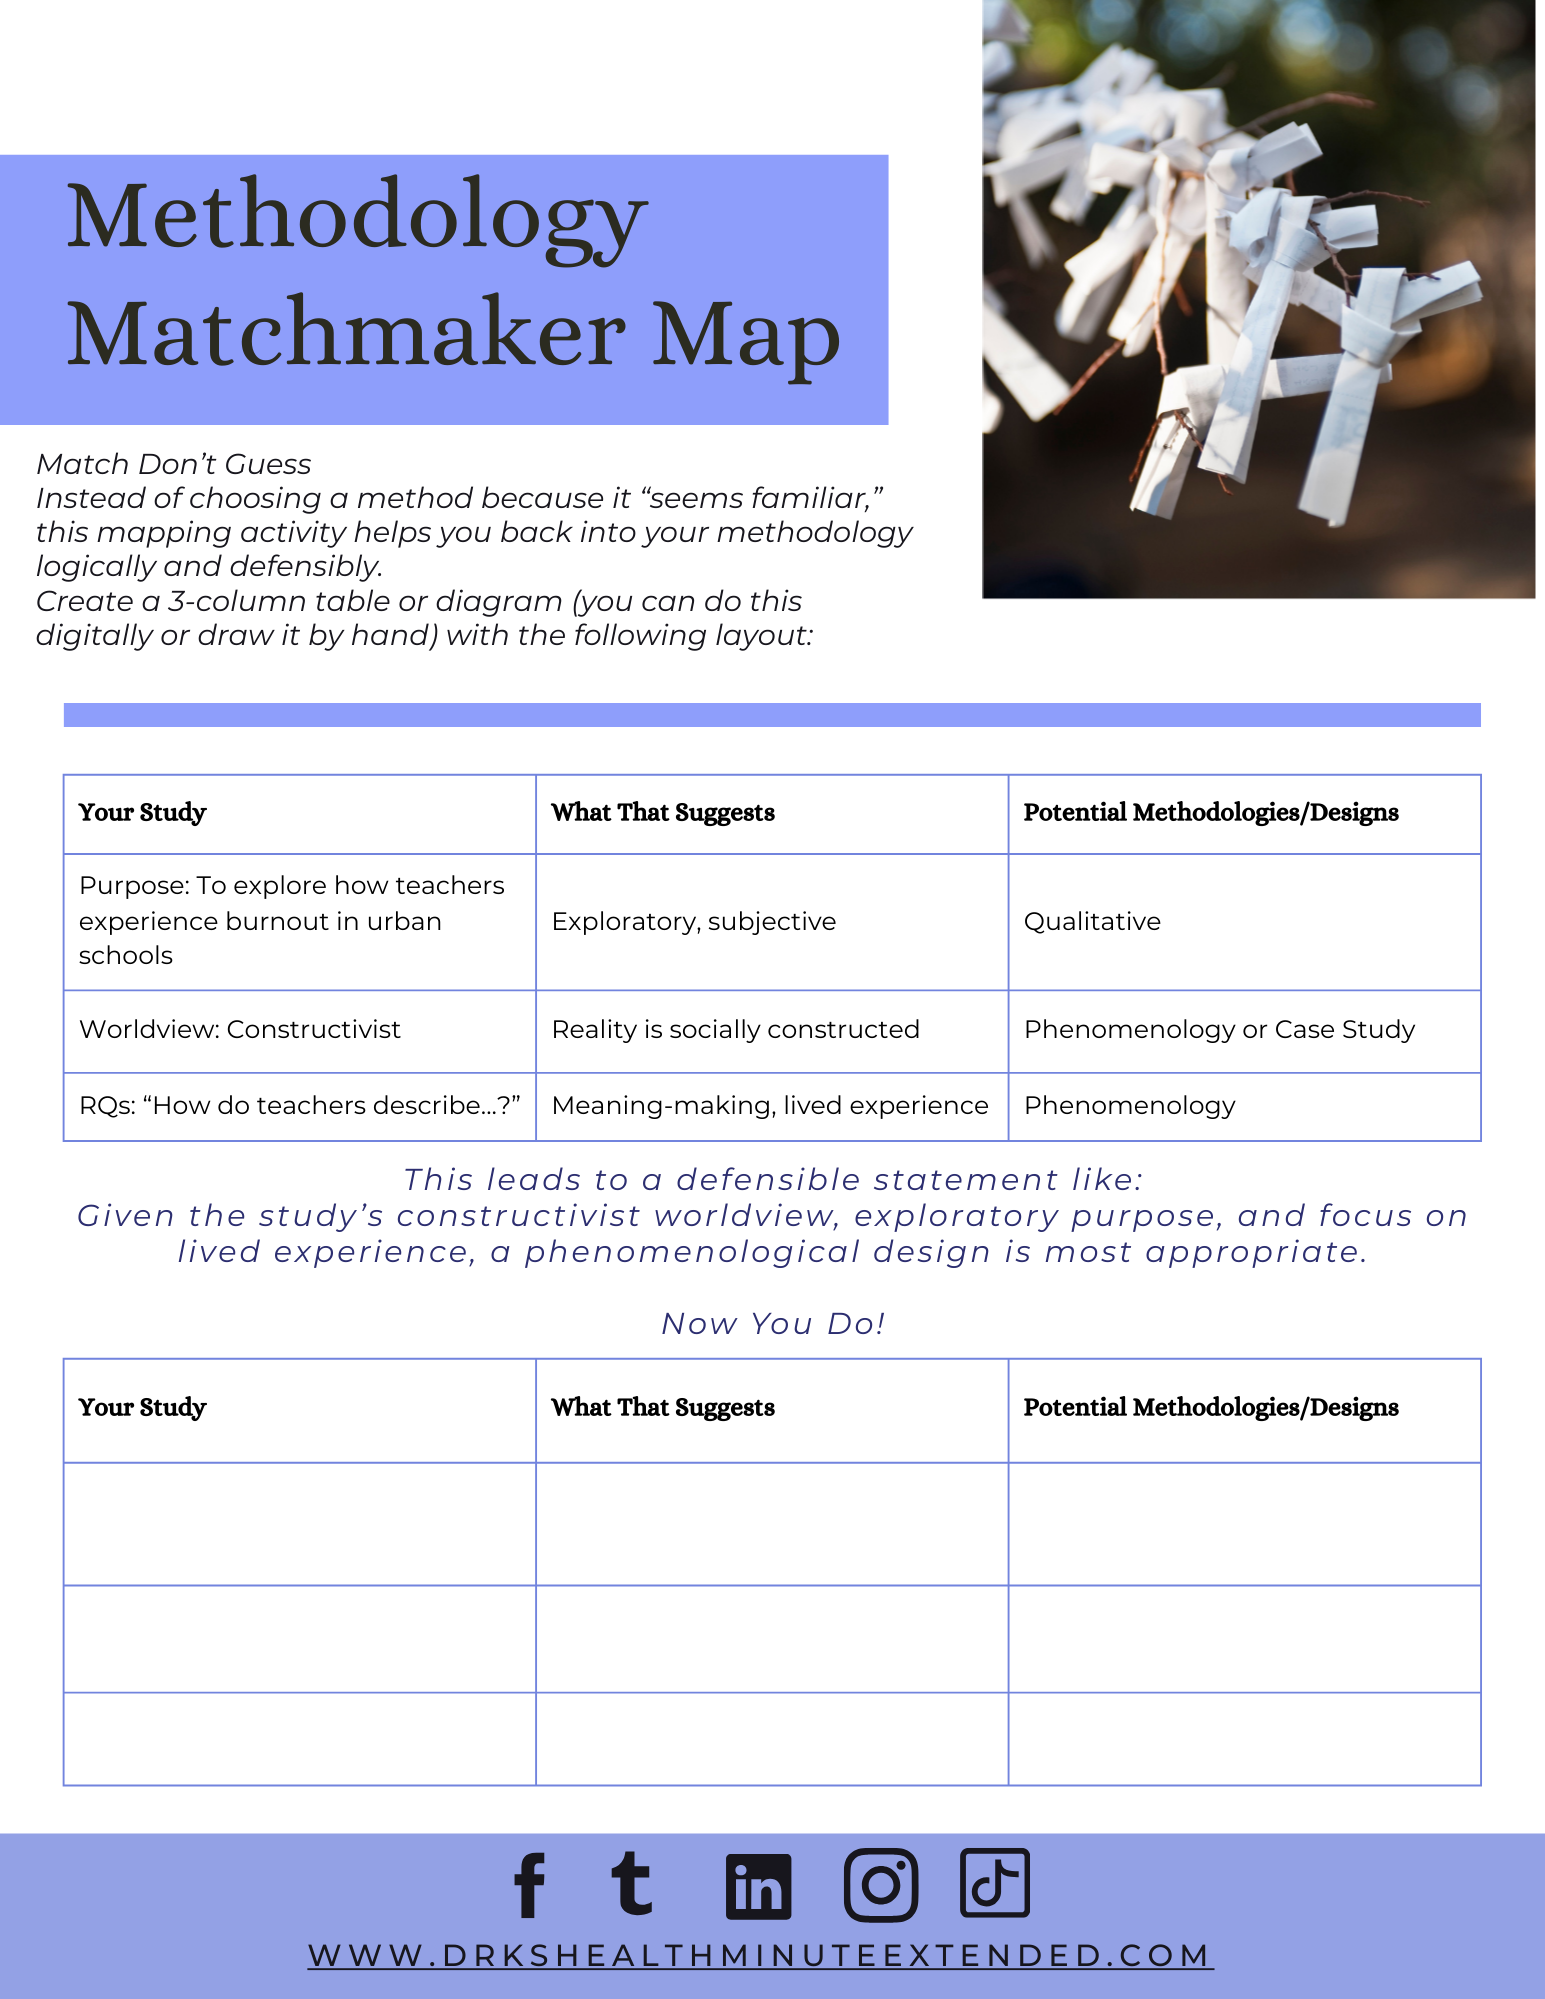
The Match: Results-to-RQ Alignment Map to connect results, themes, or integrated findings to specific research questions or hypotheses.
Prompts to identify the variables, constructs, evidence sources, and reporting elements associated with each question.
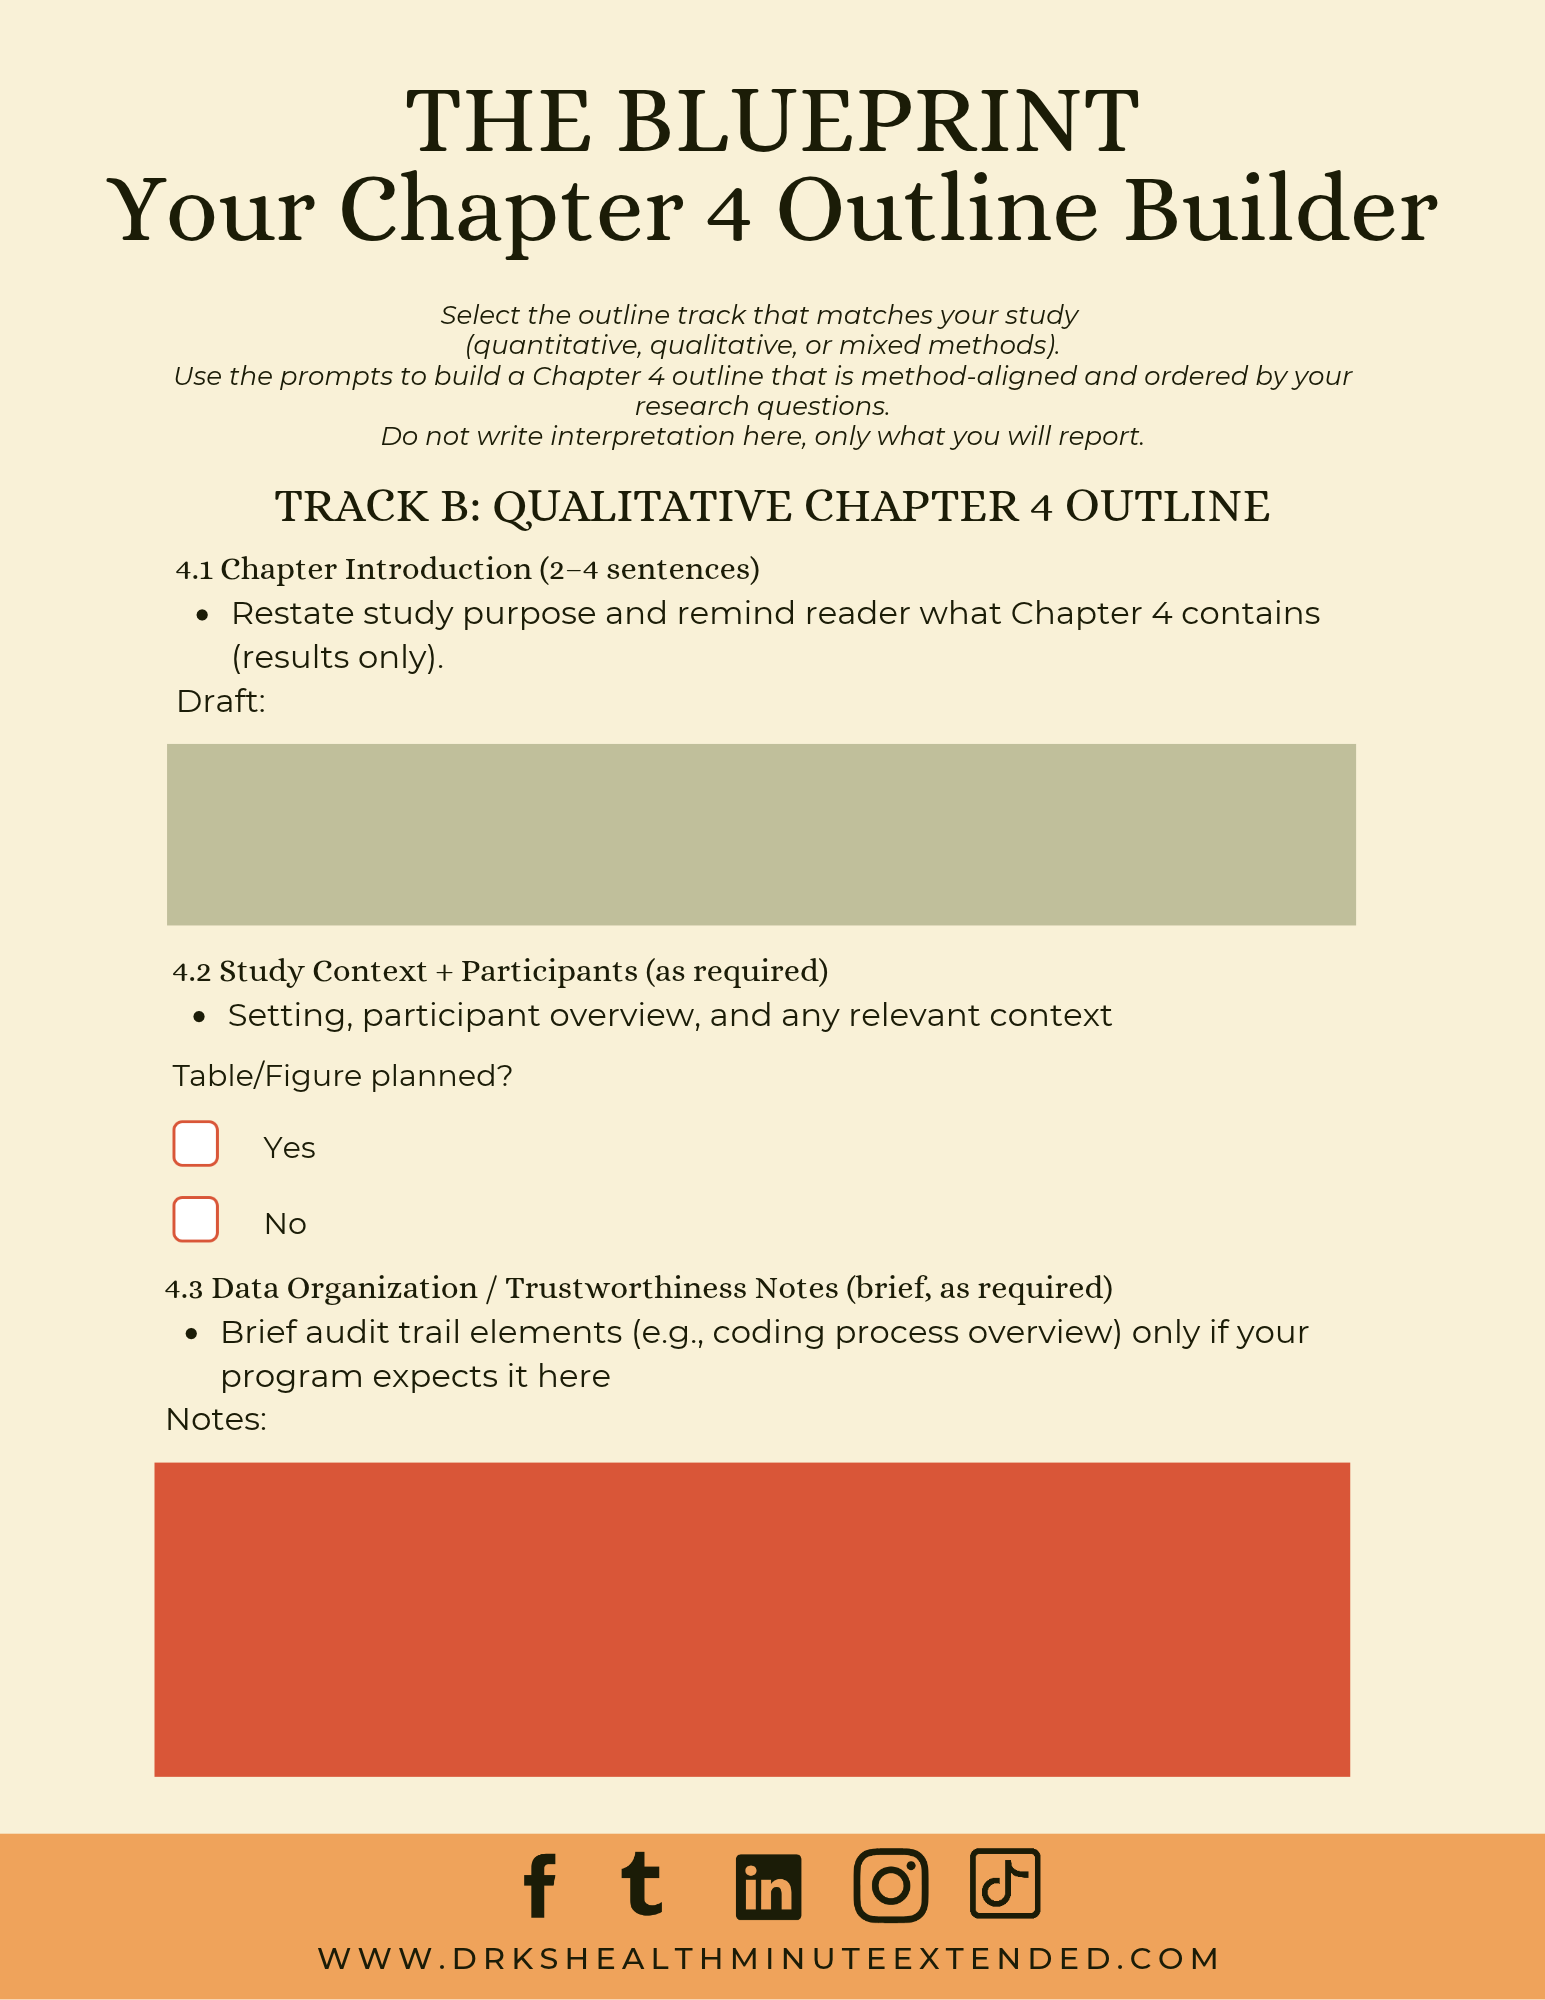
The Blueprint: Your Chapter 4 Outline Builder, with separate tracks for quantitative, qualitative, and mixed methods studies.
Planning tools to establish a logical reporting order and maintain consistent terminology across your chapter.
A section checklist to catch disconnected findings, inconsistent labels, and interpretation that belongs in the discussion.
You’ll move from a collection of outputs to a clear plan for presenting your study.
A table should help your reader understand the findings.
A figure should make something clearer.
A participant quote should support a theme.
None of them should leave your reader asking, “What am I supposed to notice?”
This section helps you plan displays that serve a clear purpose.
You’ll work through:
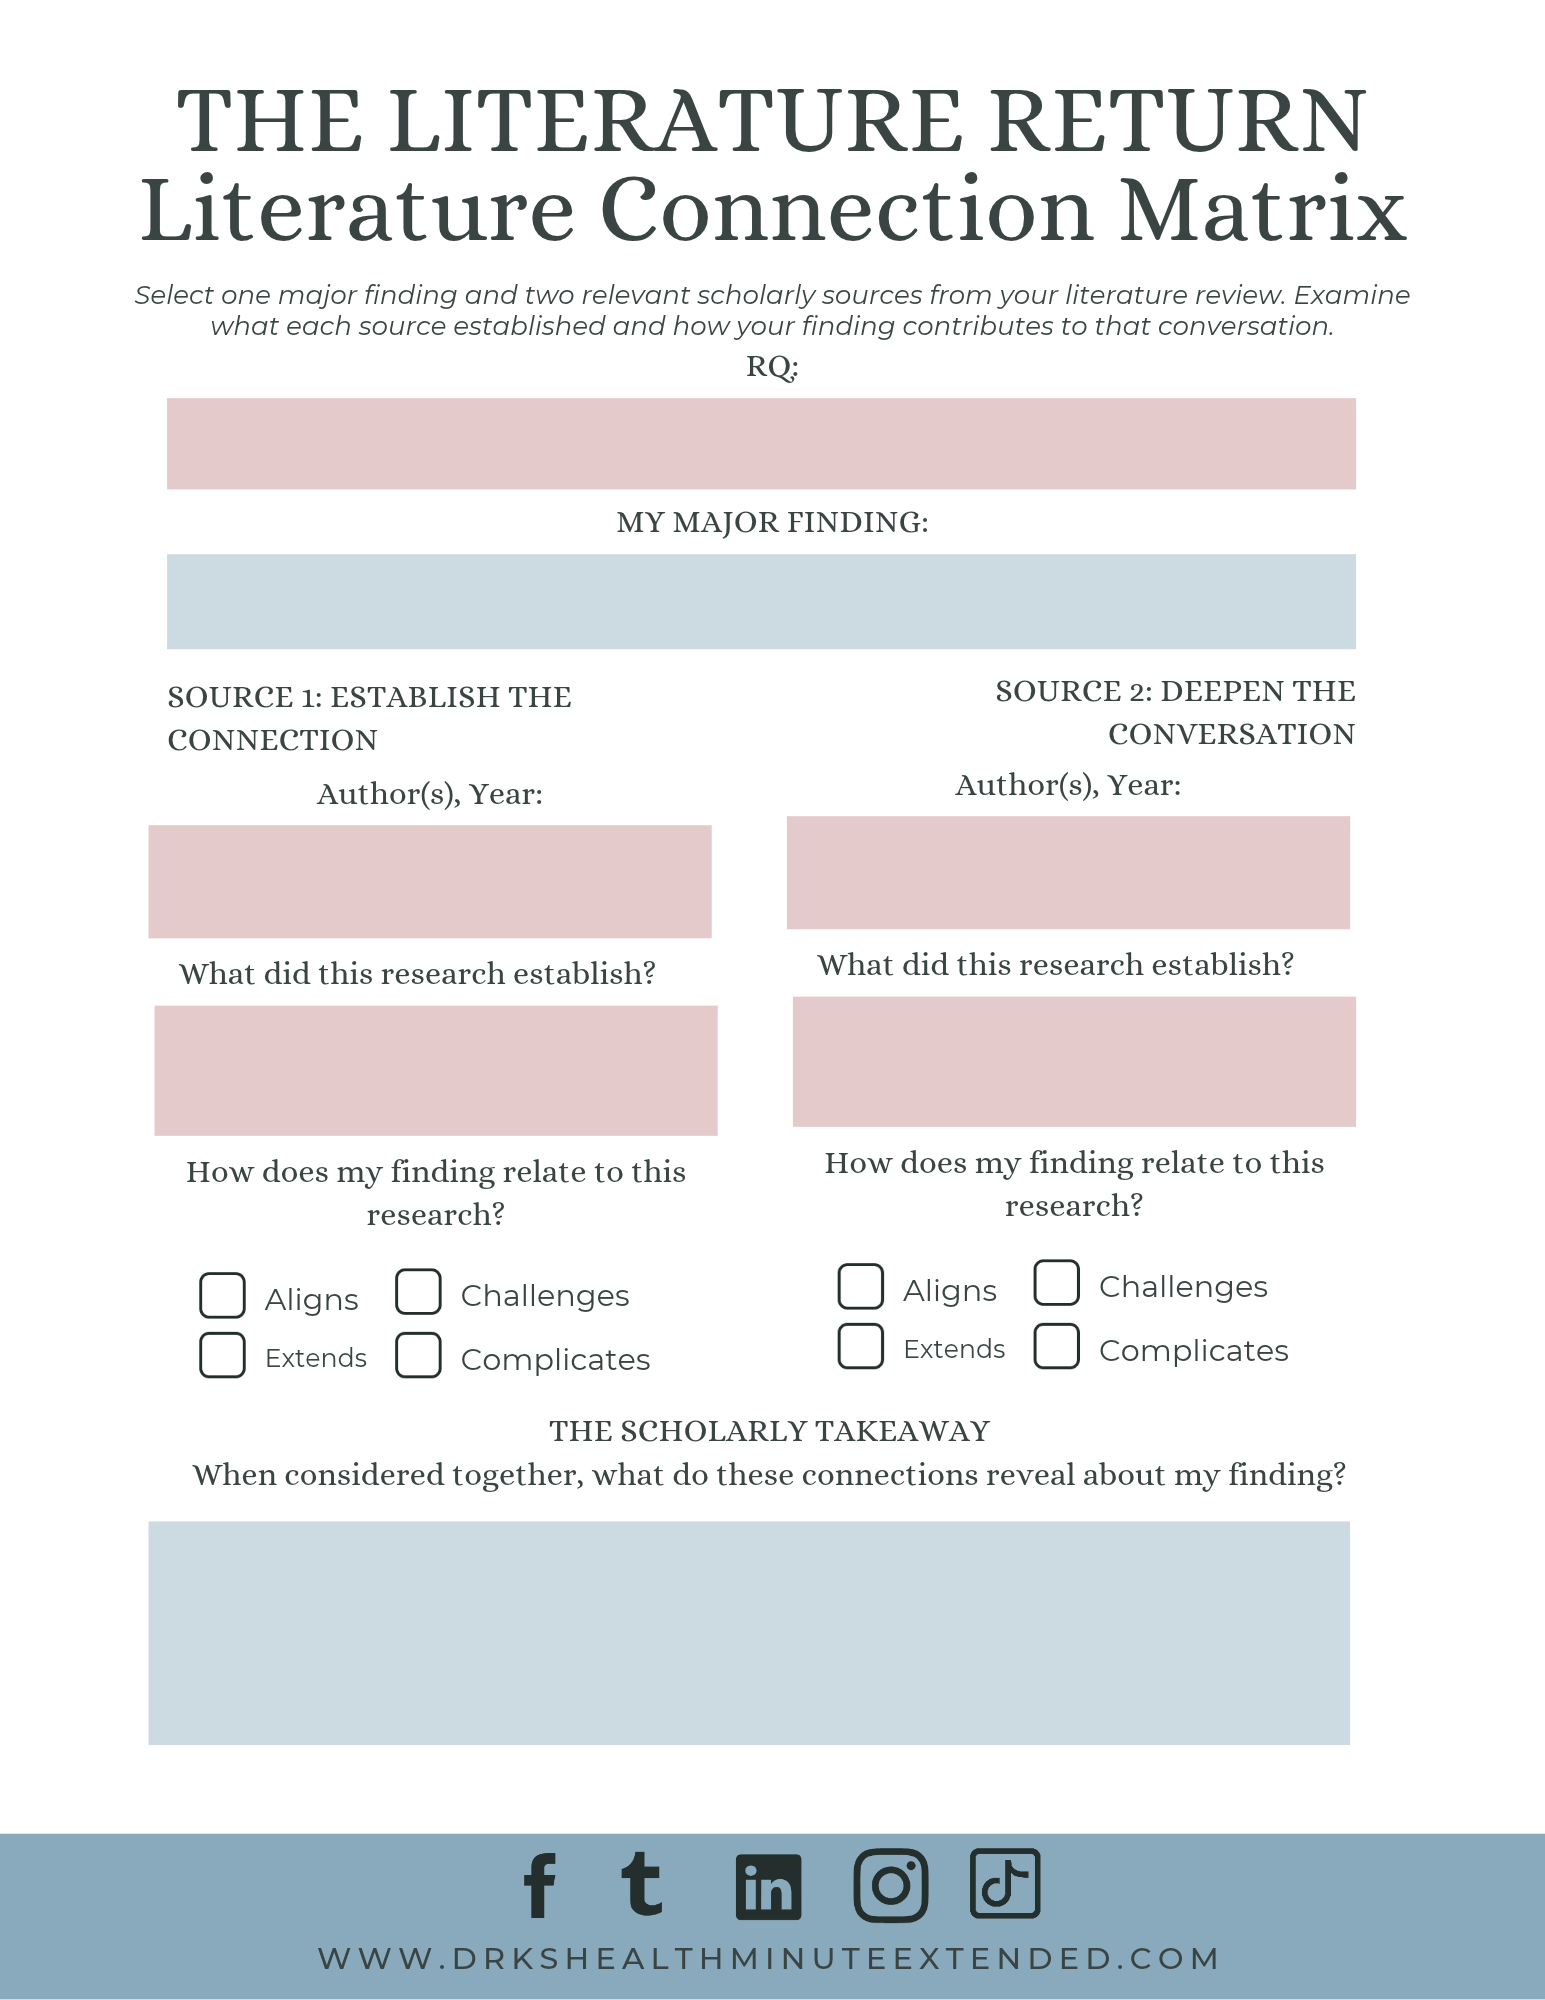
The Showcase: Tables & Figures Storyboard to plan each display’s purpose, research question connection, title, labels, and key takeaway.
The Display: Build Your Results Visuals, with structures for quantitative results, qualitative themes and evidence, and mixed methods joint displays.
Prompts to decide what readers should notice first and how your narrative will direct their attention.
Guidance for selecting purposeful excerpts that illustrate qualitative findings.
A Readability Check to examine whether readers can understand a display without you standing beside them explaining it.
You’ll develop display structures that support your writing without repeating every detail in paragraph form.
You know what your findings are. Now you need sentences that communicate them clearly.
This section helps you move from statistical output, coded themes, or integrated evidence into a focused results narrative.
You’ll work through:
The Voice: Results Narrative Builder, with separate tracks for quantitative, qualitative, and mixed methods reporting.
Quantitative paragraph prompts to connect research questions, analyses, statistical findings, and relevant displays.
Qualitative narrative prompts to develop thematic claims, incorporate participant evidence, and connect findings to research questions.
Mixed methods prompts to bring quantitative and qualitative evidence together in an integrated results paragraph.
Worked examples that demonstrate the move from evidence to scholarly reporting.
A Discussion Creep Detector to identify statements that belong in Chapter 4, need revision, or should move into Chapter 5.
A recap checklist to review accuracy, evidence, consistency, and scholarly boundaries.
You’ll practice explaining what the evidence revealed while saving broader meaning, implications, and recommendations for the appropriate discussion.
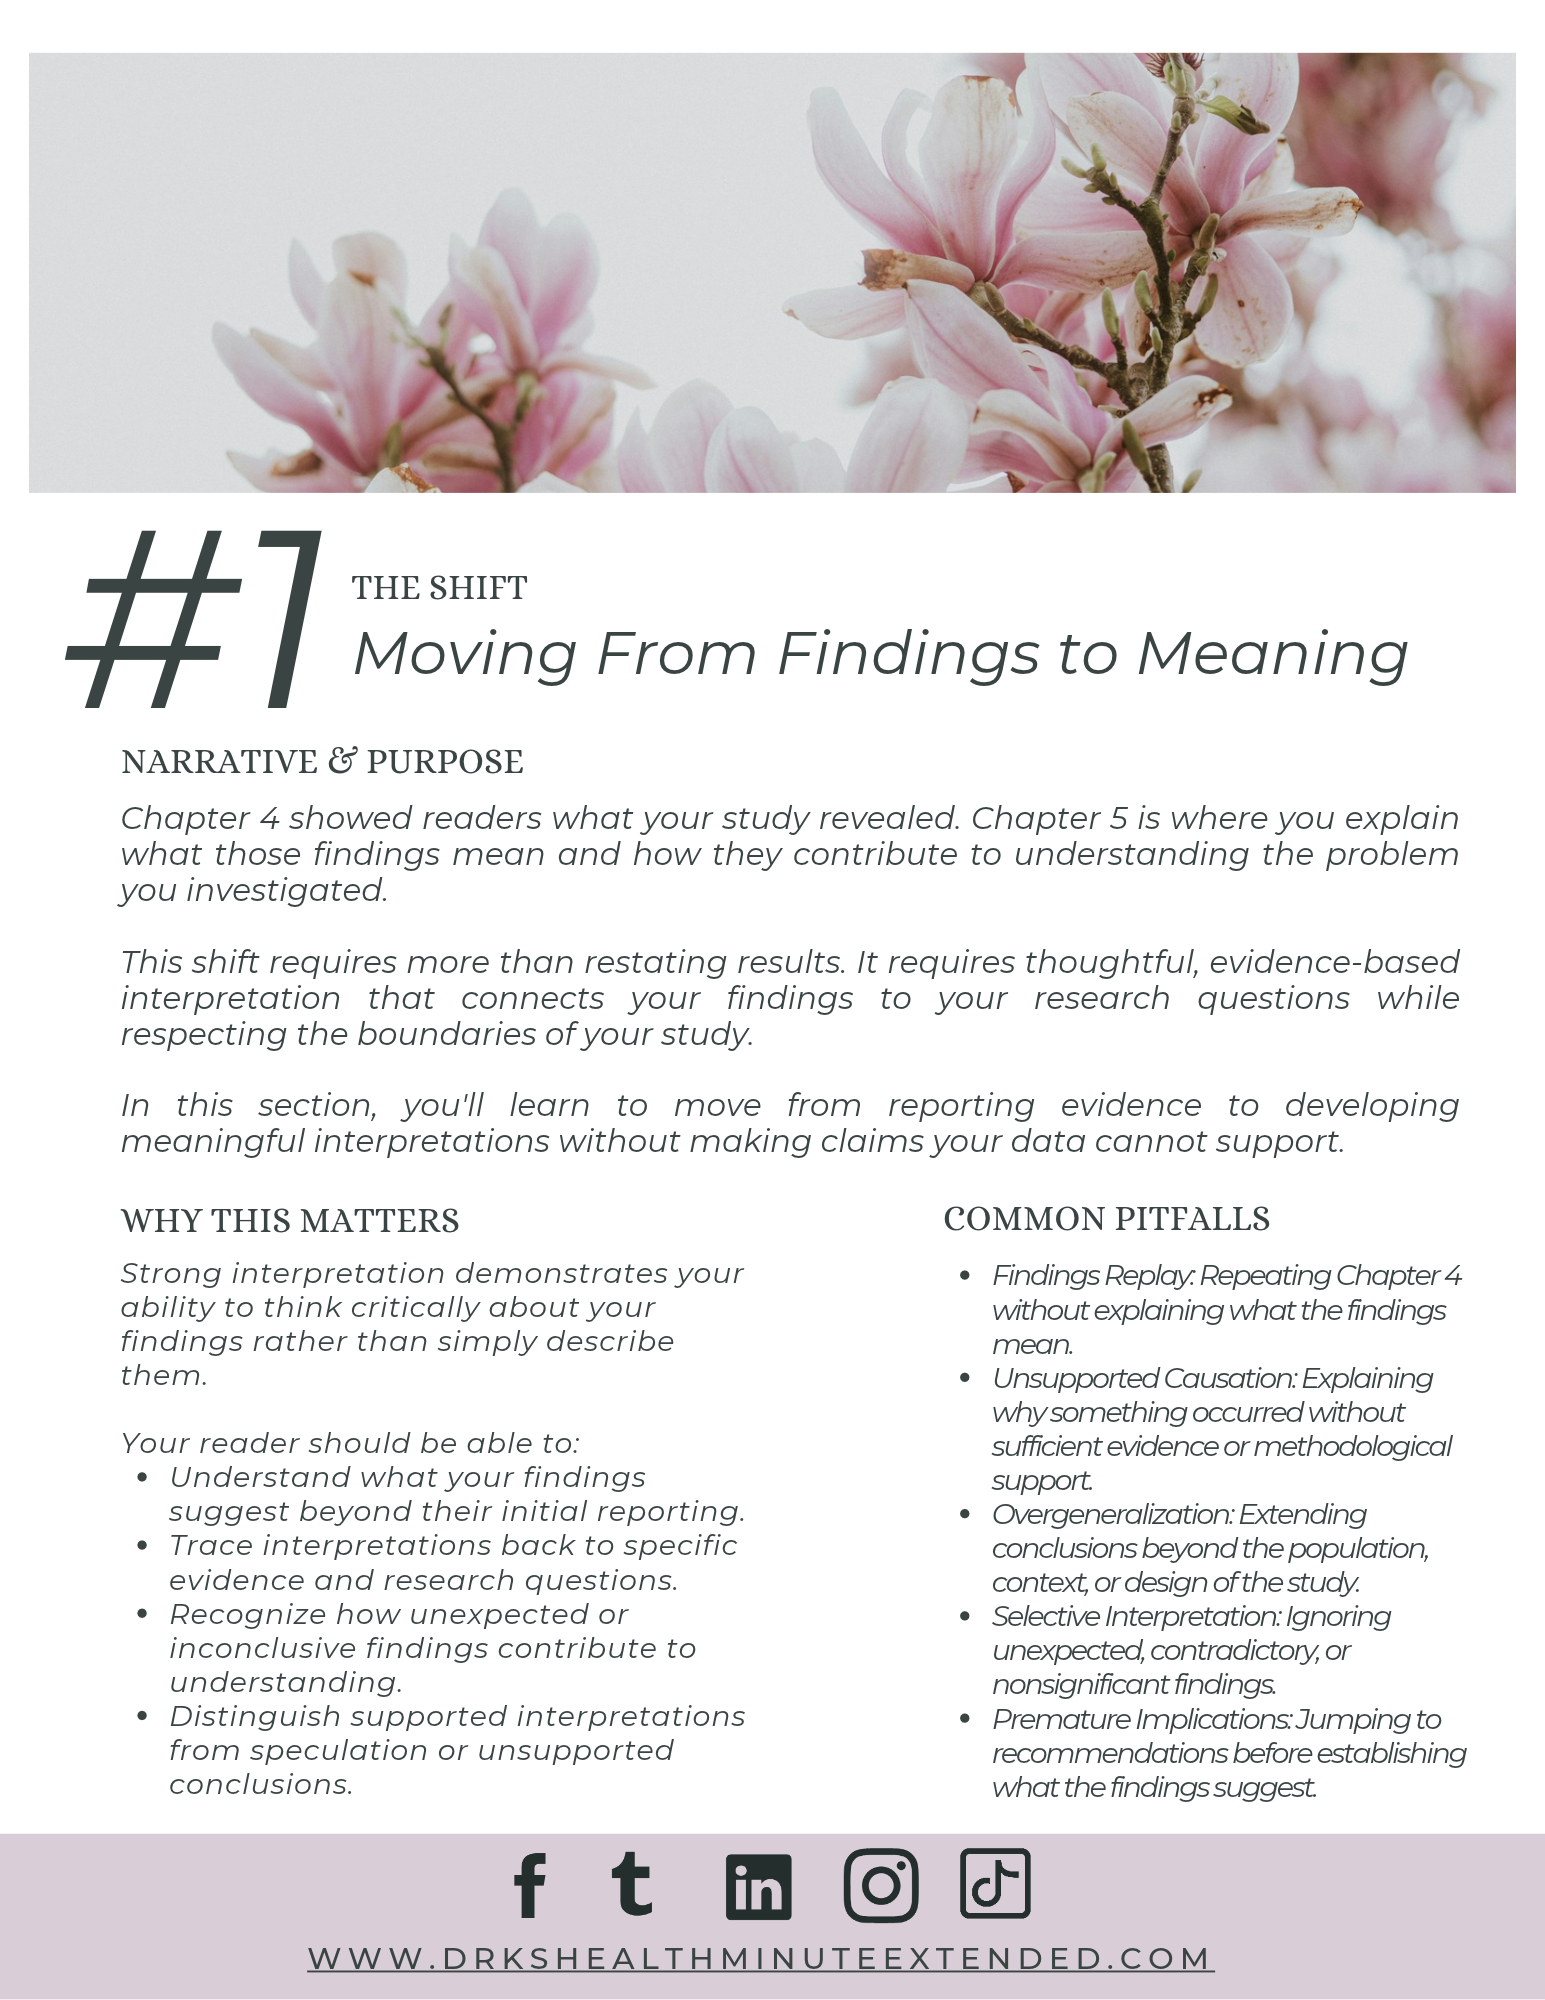
(When you’re ready to interpret your findings and explain why they matter, The Meaning picks up where The Reveal leaves off.)
Doctoral and thesis writers who have findings but feel unsure how to organize Chapter 4.
Quantitative researchers trying to turn statistical output into readable scholarly writing.
Qualitative researchers working to present themes with clear claims and purposeful participant evidence.
Mixed methods researchers who need help organizing and reporting integrated findings.
Students receiving feedback about table dumping, inconsistent terminology, unclear organization, or “too much discussion” in their results chapter.
By working through The Reveal, you’ll develop:
A results-to-research-question alignment map that gives your findings a clear reporting purpose.
A Chapter 4 outline suited to your method and study design.
Planned tables, figures, matrices, or joint displays with clear reader takeaways.
Draft results paragraphs grounded in your actual findings.
A clearer distinction between reporting results and discussing their meaning.
A structured foundation for moving into Chapter 5 with confidence.
You’ve collected the data.
You’ve examined the patterns.
Now you have to show readers what your study revealed.
And suddenly, having results and writing about them feel like two very different things.
Which findings go where?
How much of that table needs to be explained?
How do you present participant voices without turning your chapter into a collection of quotes?
And how do you keep yourself from writing Chapter 5 before you’ve finished Chapter 4?
The Reveal: Analyzing and Presenting Results with Confidence is a digital workbook designed to move you from “I have the findings” to “I know how to present them.” Through guided activities, method-specific planning tools, and paragraph builders, you’ll organize your results, develop readable displays, and write a chapter that clearly answers your research questions.
Created by Dr. Rahmatu “Dr. K.” Kassimu, this workbook walks you through the decisions that make Chapter 4 organized, aligned, and grounded in your evidence.
The Reveal is built around three core moves:
Your Chapter 4 needs a clear reporting structure. Readers should be able to follow the connection between what you asked, how you investigated it, and what you found.
This section helps you organize your findings with intention.
You’ll work through:
The Match: Results-to-RQ Alignment Map to connect results, themes, or integrated findings to specific research questions or hypotheses.
Prompts to identify the variables, constructs, evidence sources, and reporting elements associated with each question.
The Blueprint: Your Chapter 4 Outline Builder, with separate tracks for quantitative, qualitative, and mixed methods studies.
Planning tools to establish a logical reporting order and maintain consistent terminology across your chapter.
A section checklist to catch disconnected findings, inconsistent labels, and interpretation that belongs in the discussion.
You’ll move from a collection of outputs to a clear plan for presenting your study.
A table should help your reader understand the findings.
A figure should make something clearer.
A participant quote should support a theme.
None of them should leave your reader asking, “What am I supposed to notice?”
This section helps you plan displays that serve a clear purpose.
You’ll work through:
The Showcase: Tables & Figures Storyboard to plan each display’s purpose, research question connection, title, labels, and key takeaway.
The Display: Build Your Results Visuals, with structures for quantitative results, qualitative themes and evidence, and mixed methods joint displays.
Prompts to decide what readers should notice first and how your narrative will direct their attention.
Guidance for selecting purposeful excerpts that illustrate qualitative findings.
A Readability Check to examine whether readers can understand a display without you standing beside them explaining it.
You’ll develop display structures that support your writing without repeating every detail in paragraph form.
You know what your findings are. Now you need sentences that communicate them clearly.
This section helps you move from statistical output, coded themes, or integrated evidence into a focused results narrative.
You’ll work through:
The Voice: Results Narrative Builder, with separate tracks for quantitative, qualitative, and mixed methods reporting.
Quantitative paragraph prompts to connect research questions, analyses, statistical findings, and relevant displays.
Qualitative narrative prompts to develop thematic claims, incorporate participant evidence, and connect findings to research questions.
Mixed methods prompts to bring quantitative and qualitative evidence together in an integrated results paragraph.
Worked examples that demonstrate the move from evidence to scholarly reporting.
A Discussion Creep Detector to identify statements that belong in Chapter 4, need revision, or should move into Chapter 5.
A recap checklist to review accuracy, evidence, consistency, and scholarly boundaries.
You’ll practice explaining what the evidence revealed while saving broader meaning, implications, and recommendations for the appropriate discussion.
(When you’re ready to interpret your findings and explain why they matter, The Meaning picks up where The Reveal leaves off.)
Doctoral and thesis writers who have findings but feel unsure how to organize Chapter 4.
Quantitative researchers trying to turn statistical output into readable scholarly writing.
Qualitative researchers working to present themes with clear claims and purposeful participant evidence.
Mixed methods researchers who need help organizing and reporting integrated findings.
Students receiving feedback about table dumping, inconsistent terminology, unclear organization, or “too much discussion” in their results chapter.
By working through The Reveal, you’ll develop:
A results-to-research-question alignment map that gives your findings a clear reporting purpose.
A Chapter 4 outline suited to your method and study design.
Planned tables, figures, matrices, or joint displays with clear reader takeaways.
Draft results paragraphs grounded in your actual findings.
A clearer distinction between reporting results and discussing their meaning.
A structured foundation for moving into Chapter 5 with confidence.